
Statistics: Line of Best Fit: Least-Squares Regression simulation
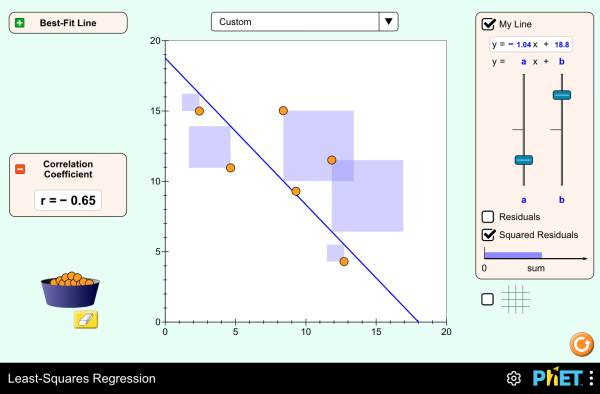
Plot data and fit a line of best fit; see residuals and the correlation. This free Mathematics lab suits Form 4, Form 5, Form 6 students and runs in any modern phone or computer browser.
Key idea
y = mx + c
Student tasks
- Plot your own data points and place a line of best fit by eye.
- Show the best-fit line and compare it with yours.
More Mathematics labs
- Differentiation: Gradient of a CurveCalculus Grapher · Form 4–6
- Graphs of Functions & EquationsDesmos Graphing Calculator · Form 2–6
- Constructions, Transformations & Circle TheoremsGeoGebra Geometry · Form 1–6
- Probability & the Normal DistributionPlinko Probability · Form 4–6
- 3D Geometry, Vectors & SurfacesGeoGebra 3D Calculator · Form 5–6
- Trigonometry: Unit Circle, Sine, Cosine & TangentTrigonometry Tour (Unit Circle) · Form 4–5